SciTeX Stats
Publication-ready statistical testing with 23 tests, effect sizes, power analysis, and APA formatting
SciTeX Stats provides a unified interface for the full statistical workflow: from test recommendation through execution to publication-ready output. All 23 tests return a consistent result dictionary with test statistics, p-values, effect sizes, power analysis, and APA-formatted strings.
Getting Started
API Reference
- API Reference
- Functionalities
- IO
- Dependencies
run_test()available_tests()describe()to_json_safe()Statstest_result_to_stats()save_stats()load_stats()to_figrecipe()annotate()load_and_annotate()StatContextTestRuleStatStylerecommend_tests()check_applicable()get_stat_style()p_to_stars()test_ttest_ind()test_ttest_rel()test_ttest_1samp()test_anova()test_anova_rm()test_anova_2way()test_brunner_munzel()test_wilcoxon()test_kruskal()test_mannwhitneyu()test_friedman()test_pearson()test_spearman()test_kendall()test_theilsen()test_chi2()test_fisher()test_mcnemar()test_cochran_q()test_shapiro()test_normality()test_ks_1samp()test_ks_2samp()test_kendalls_w()test_icc()
Examples
Quick Example
import scitex_stats as ss

# Get test recommendation
ctx = ss.StatContext(
    n_groups=2, sample_sizes=[30, 30],
    outcome_type="continuous", design="between", paired=False,
)
recs = ss.recommend_tests(ctx)

# Run a test
result = ss.run_test("ttest_ind", data=group1, data2=group2)

# APA-formatted output
print(result["formatted"])
# t = -3.210, p = 0.0022, Cohen's d = -0.829, **
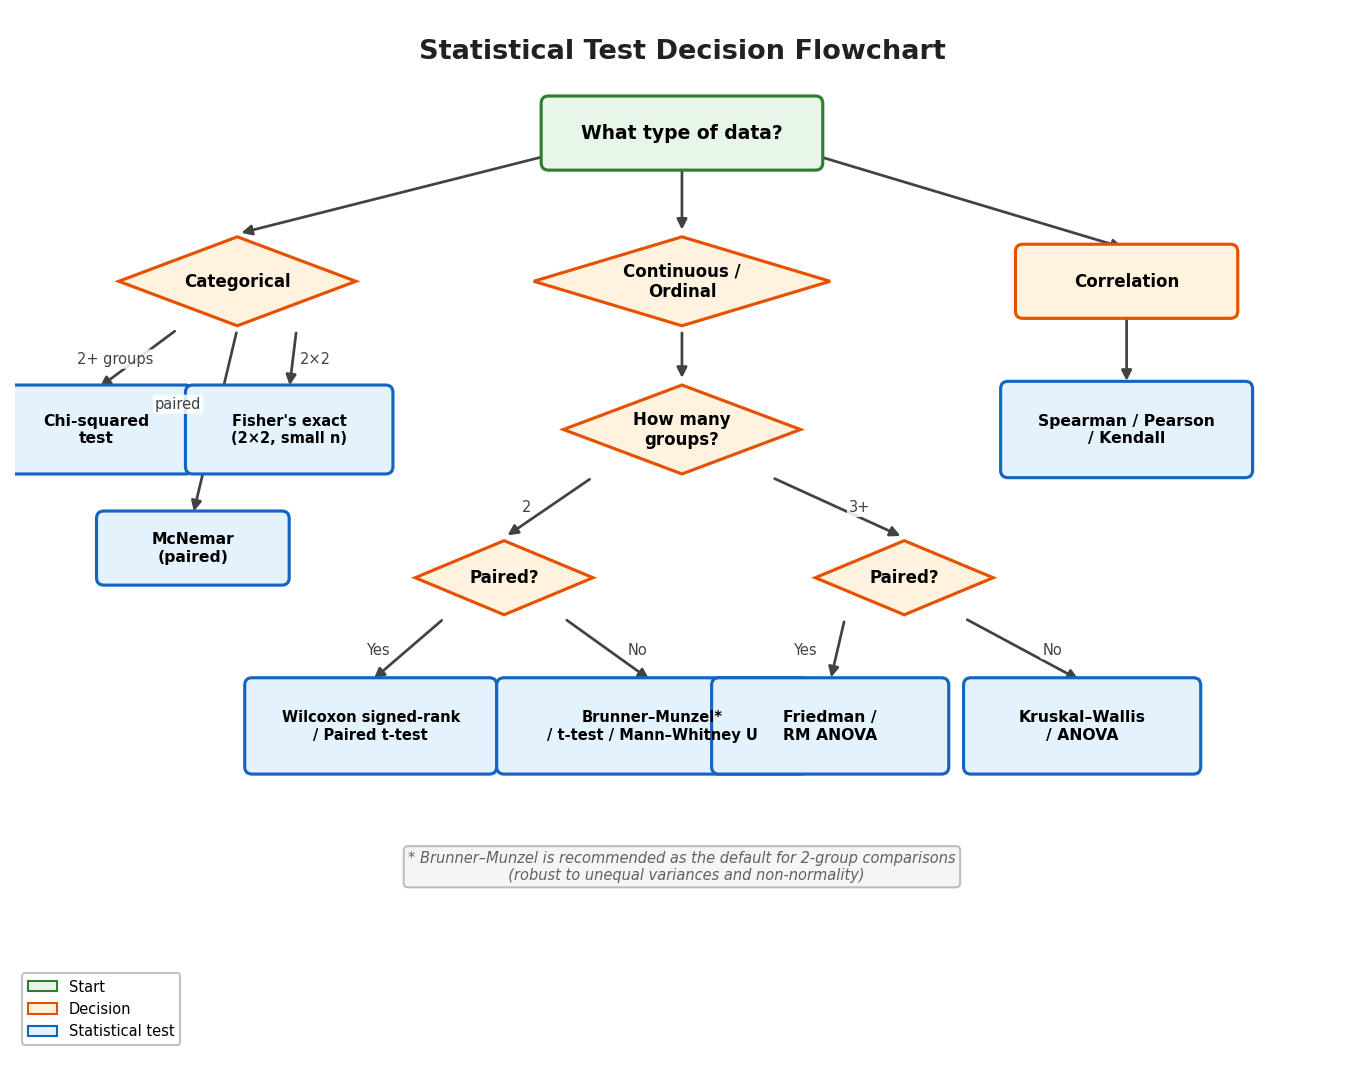
Figure 1. Decision flowchart for choosing a statistical test. Starting from data type (categorical vs. continuous), the tree guides researchers through number of groups and study design to the appropriate test. Brunner-Munzel is recommended as the default for two-group comparisons due to its robustness.